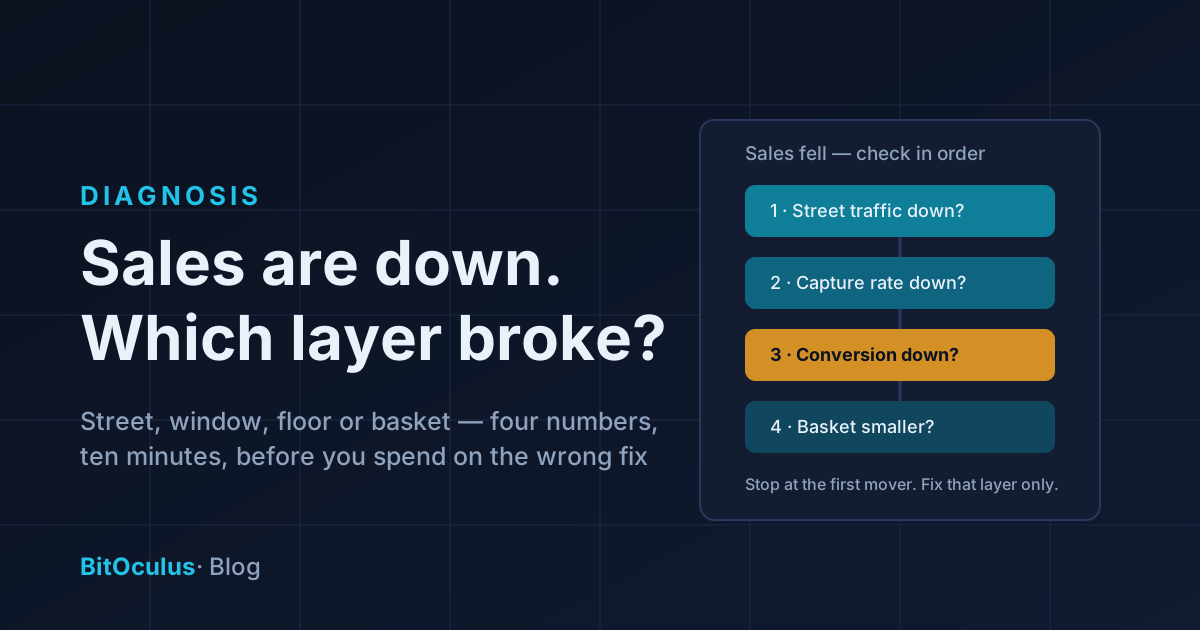
When retail sales fall, the cause sits in exactly one of four places: the street (fewer people passing), the window (fewer passers-by entering), the floor (fewer visitors buying), or the basket (buyers spending less). Each has a completely different fix — and a register can only see the last one, which is why unmeasured stores so often treat a street problem with a floor fix, or panic-discount their way through what was actually roadworks. The diagnosis takes four numbers and about ten minutes. The wrong guess takes months and a marketing budget.
Here's the diagnostic tree, top to bottom, with what each branch means and what actually fixes it.
Why the register can't diagnose its own decline
A sales report is the product of four factors: passers-by × capture rate × conversion × average sale. When the product falls, the register tells you nothing about which factor moved — a 15% sales dip looks identical whether the street went quiet, the window stopped working, the floor stopped converting, or shoppers tightened their baskets.
Yet each cause points to a different owner and a different spend. Street problems are about location, season and marketing reach. Window problems are fixed at the glass. Floor problems are usually roster and service problems. Basket problems are range and pricing. Money aimed at the wrong layer isn't just wasted — it delays the real fix by a quarter. This is the store-level version of the attribution logic we've applied to growth and to multi-site comparisons: separate what the environment did from what the store did.
The prerequisite is the funnel's four numbers — street traffic, capture rate, conversion, and average sale — trended against your own baseline. (No baseline yet? That's the first fix: you're currently diagnosing blind, and a sensor installed this month turns the next dip into a ten-minute diagnosis.)
The diagnostic tree
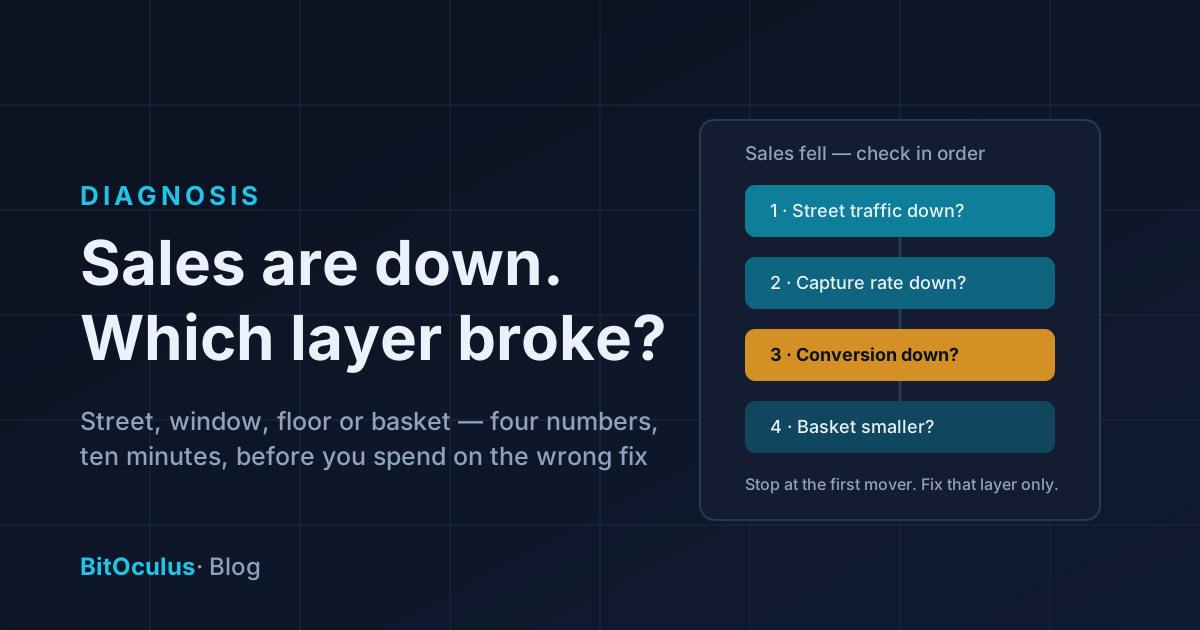
Work top-down; stop at the first number that's moved materially against baseline.
Branch 1: Street traffic fell — it's (probably) not you
If passers-by are down against your baseline, the cause is outside your four walls: seasonality, weather runs, roadworks, a changed bus route, a closed neighbouring anchor, or the precinct itself cooling. Sanity-checks: is the drop across all day-parts or specific ones? Did it start abruptly (an event — something changed on the street) or drift (a trend)?
What works: patience for the temporary causes; marketing that generates trips (not window fixes — there's no one there to see them) for the persistent ones; and documentation always. A measured street decline is rent-review evidence — if the location is delivering less, that's a negotiation, not just a lament. What doesn't: discounting. A promotion can't reach people who no longer walk past.
Branch 2: Street held, capture fell — it's the window
Same crowds, fewer entering. Something at the glass stopped working: a stale display the regulars have gone blind to, new visual competition next door, dead lighting after dusk, or friction at the threshold. This is the highest-ROI branch to land on, because the audience is still there — the fixes are at the window and they're cheap.
What works: treat the shopfront like a landing page — one message, refreshed on a cadence, tested against your own capture-rate baseline. What doesn't: more advertising. You'd be paying to send more people past a window that's already failing the ones who pass.
Branch 3: Capture held, conversion fell — it's the floor
People still come in; fewer buy. Before blaming demand, check the floor's mechanics in order: staffing against the curve (did rosters drift from the traffic peaks? — the evidence says understaffed peaks quietly tax conversion exactly when it's most expensive (Mani, Kesavan & Swaminathan, 2015), and thin floors make every extra visitor worth less (Perdikaki, Kesavan & Swaminathan, 2012)); bounce rate (a rising early-exit share points at queues, layout or first impressions rather than range); stock and range (the one the team will name first — verify it second, after the two the data can check).
What works: re-time the roster to the measured peaks, kill the queue with a live alert, fix what bounce points at. What doesn't: traffic spend. Pouring more visitors onto a floor that stopped converting multiplies the leak, not the sales.
Branch 4: Everything held, basket fell — it's the offer (or the economy)
Traffic, capture and conversion steady, but each sale is smaller: range, pricing, or simply customers economising. This is the one branch where the register alone was actually telling the truth — and the funnel's contribution is ruling out the other three so you can act on price and range with confidence instead of superstition.
Two rules that keep the diagnosis honest
Compare like periods. This week against the same week last month or last year — not against the school-holiday week before. Traffic has rhythms; a "decline" that's really seasonality sends you fixing a window that was never broken. (Your own seasonal curve is the calibration.)
One dip is noise; three points is a trend. Retail weeks are lumpy. React to sustained movement against baseline, not to a single bad Tuesday — the same discipline that applies to reading any store experiment.
Frequently asked questions
Why are my retail sales declining when foot traffic seems normal?
"Seems" is the trap — measure it. If street traffic and entries genuinely held, the decline lives in conversion or basket size: check roster-versus-peaks alignment, bounce rate and queues first (the measurable causes), then range and pricing. If you're judging traffic by eye, an accurate counter frequently reveals the traffic did move and the floor was never the problem.
How do I know if falling sales are my store's fault or the location's?
Split the funnel: street traffic is the location's contribution; capture rate and conversion are yours. A falling street count with steady capture and conversion is an environment problem — season, precinct, access — while steady street traffic with falling capture or conversion points inside. The distinction changes everything: one is a marketing-and-lease conversation, the other an operations fix.
What should I check first when sales drop?
Four numbers against baseline, in order: passers-by, capture rate, conversion, average sale. Stop at the first material mover — that's your branch. Check like-for-like periods (same weeks, prior year) and insist on a sustained trend before acting; a single soft week is usually noise.
Can discounting fix falling sales?
Only when the diagnosis says the problem is the offer (branch 4) — and even then, range and value perception often beat blanket discounts. Discounting a street problem reaches no one; discounting a window problem pays people who were already coming in; discounting a conversion problem subsidises a floor that isn't serving. Diagnose first; discount last.
BitOculus gives you the four numbers the diagnosis needs — street, capture, conversion and the hourly curve behind them — measured at your door, on-device, with no footage ever stored. Next dip, know in ten minutes: explore a live dashboard or join the founding cohort.