A people counter pays for itself through four metrics: capture rate (what share of passers-by walk in), true conversion (what share of visitors buy), bounce rate (what share of walk-ins leave almost immediately) and power hours (when your traffic actually peaks). Each one maps to a decision you can make this week — and published retail studies show stores that act on traffic data typically lift conversion by double digits in the first year.
Your point of sale tells you everything about the sales you made and nothing about the ones you didn't. An online store knows its traffic, bounce rate and conversion to the decimal; most physical stores are flying blind on all three. Here's what each metric means, how it's calculated, and what to do with it.
1. Capture rate: how good is your shopfront at stopping feet?
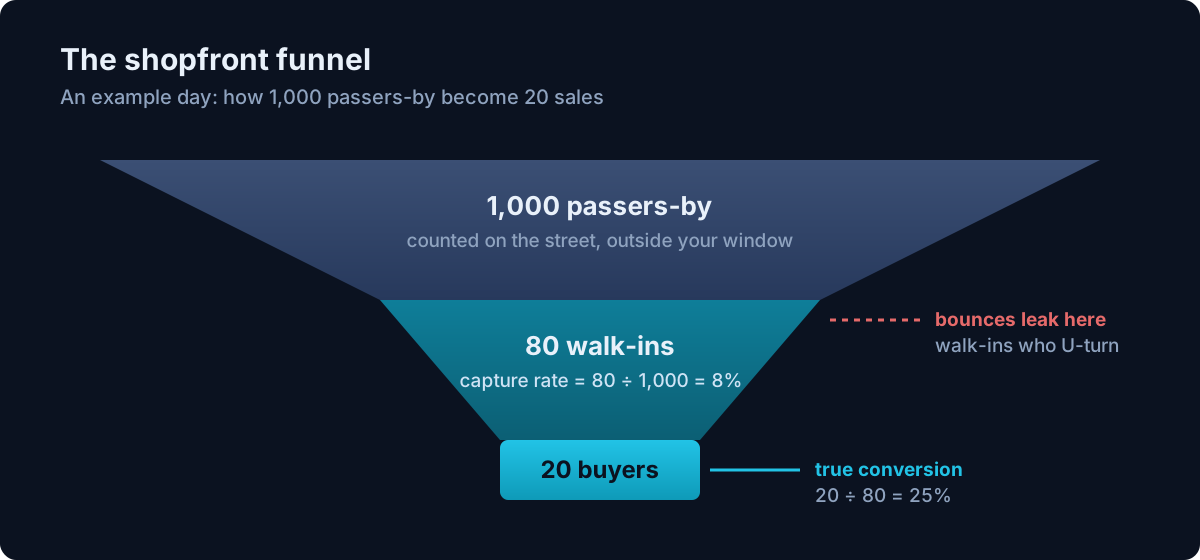
Formula: capture rate = walk-ins ÷ passers-by.
Capture rate is the most underrated number in retail because almost nobody can measure it — it requires counting the street, not just the door. An outdoor-capable AI sensor counts the people who walk past your window and the people who walk through your door, and the ratio between them tells you how hard your shopfront is working.
- Typical range: for most high-street retail, capture rates sit somewhere between 5% and 20%, varying hugely by category and location.
- What moves it: window displays, signage, lighting, an open vs closed door, street appeal.
- How to use it: treat your shopfront like a landing page. Change your window display on Monday, watch capture rate by Friday. For the first time, "did the new window work?" has a numeric answer.
2. True conversion: sales ÷ real visitors, finally
Formula: true conversion = transactions ÷ visitors.
Most stores that attempt conversion divide sales by a guess. The result is a number you can't trust and won't act on. Conversion only becomes useful when the denominator is real: exact visitor counts with staff filtered out and repeat entries deduplicated — the shopper who steps out for a phone call shouldn't count twice.
- Typical range: physical retail conversion commonly falls between 20% and 40% — far higher than e-commerce, which is exactly why every lost visitor is expensive.
- What moves it: staffing levels, sales coaching, product availability, queue length.
- How to use it: compare days, campaigns and stores with confidence. A traffic spike with flat sales is a conversion problem (floor coverage, stock); flat traffic with falling sales is a different problem entirely. Without a visitor count, those two look identical on your POS.
3. Bounce rate: the customers who almost stayed
Formula: bounce rate = U-turn visitors ÷ walk-ins.
A "bounce" is a shopper who walks in, scans the room and turns straight back around. They are your most expensive customer — your shopfront already did its job and won them, then something inside pushed them back out. On a POS report they simply don't exist.
AI sensors detect bounces through U-turn detection: a tracked path that enters and exits within moments.
- What moves it: queue length at the register, cluttered or confusing layout, no staff acknowledgement, first impressions at the threshold.
- How to use it: a rising bounce rate is the earliest warning you'll get that something inside the store is leaking money. It moves days or weeks before it shows up in revenue.
4. Power hours: roster to the curve, not the calendar
Formula: there isn't one — power hours are your hour-by-hour traffic curve, read honestly.
Most rosters are built on gut feel, and gut feel is systematically wrong in both directions: it overstaffs the dead hours (bleeding payroll) and understaffs the genuine peaks (bleeding sales, and inflating your bounce rate at the worst possible time).
- Benchmark: retailers who roster to real traffic curves typically cut labour costs by 10–20%. Most stores find double-digit payroll waste in their first month of data.
- How to use it: overlay your roster on your traffic curve. The mismatches are usually visible in the first week — and fixing them is the fastest payback any traffic metric offers.
How the four metrics work together
Read together, the four metrics tell you where in the funnel you're losing money:
- Low capture rate, healthy conversion → your store converts well but your shopfront isn't pulling people in. Work the window, not the floor.
- Healthy capture, low conversion → traffic is fine; the problem is inside. Check power hours first — understaffed peaks are the most common cause.
- Rising bounce rate → an early-warning siren for layout, queues or first impressions, whatever the other numbers say.
- All healthy → you now have proof, store by store and week by week, of what's working. That's what makes the numbers compoundable: each fix is measurable the following week.
If you want to go deeper on how the counting itself works — and why accuracy and staff filtering decide whether these metrics can be trusted — read how AI people counting cameras work.
Frequently asked questions
What is a good capture rate for a retail store?
It varies too much by category and street to give one number — destination stores see lower capture rates than impulse-driven ones. What matters is your own trend: measure a baseline for two weeks, then test changes against it.
Why is my POS conversion rate different from true conversion?
Because the denominator is different. POS-based estimates guess at visitor numbers; true conversion uses an actual count with staff excluded and repeat entries deduplicated. The gap between the two is often large enough to flip a decision.
Do I need an outdoor sensor to measure capture rate?
Yes. Capture rate requires counting passers-by on the street as well as entries, which means a weatherproof sensor that can count outdoors — see the technology comparison for why beam and thermal counters can't do this.
How quickly do these metrics pay back?
Power hours usually pay back first (roster fixes in the first month), followed by capture rate (window and signage tests) and bounce rate (layout and queue fixes). Published industry studies indicate a typical full return on investment within months, not years.
BitOculus measures all four metrics from a single sensor above your door — counted on-device, with no footage ever stored. The founding cohort gets hardware and installation on us. Join the waitlist.