The fair way to compare retail locations is to split every store's result into what the location gave it (street traffic) and what the team did with it (capture rate and conversion). A revenue league table can't tell a great team on a weak street from a coasting team on a strong one — traffic data can, and that distinction changes which store gets help, which gets copied, and which lease gets questioned. For anyone running two to twenty sites — a small chain, a franchise cluster, a multi-venue operator — this is the difference between managing stores and managing postcodes.
Here's the operating model: what to measure at every site, how to read the grid it produces, and what it changes about the weekly conversation with store managers.
The league-table lie
Every multi-site operator has a ranking, and it's almost always revenue. The problem: revenue is mostly a function of the street. Put your best manager on a frontage with a third of the passing traffic and the league table calls them your worst performer, every single week, no matter what they do. Meanwhile the store on the golden corner coasts to the top on footfall it did nothing to earn.
The register can't see this, for the same reason it can't see most of what happens on a floor: it only records outcomes, never opportunities. Two stores posting identical takings might be a thin street brilliantly converted and a busy street squandered — the same ambiguity that makes single-store revenue hard to read, multiplied across the portfolio and then acted on: bonuses, budgets, renewals and reputations all keyed to a number the location largely determines.
Three numbers per store make the comparison fair
Instrument every site the same way — street, door, floor — and each store resolves into what it was given versus what it did:
- Street traffic — the opportunity. Pure location; the team can't move it much. This is the denominator that makes everything else comparable.
- Capture rate — the shopfront's performance: window, signage, visible energy. Store-controllable.
- Conversion (and bounce) — the floor's performance: service, coverage, layout. Store-controllable, heavily staffing-dependent.
Consistency is what makes the grid honest, which is where measurement discipline earns its keep: the same sensor accuracy, the same staff filtering and deduplication at every site, or the comparison inherits every site's different errors. One store counting staff in its visitor number while another filters them isn't a benchmark — it's noise wearing a spreadsheet.
Reading the grid
Plot stores by opportunity (street traffic) against execution (capture × conversion) and four archetypes fall out, each with a different playbook:
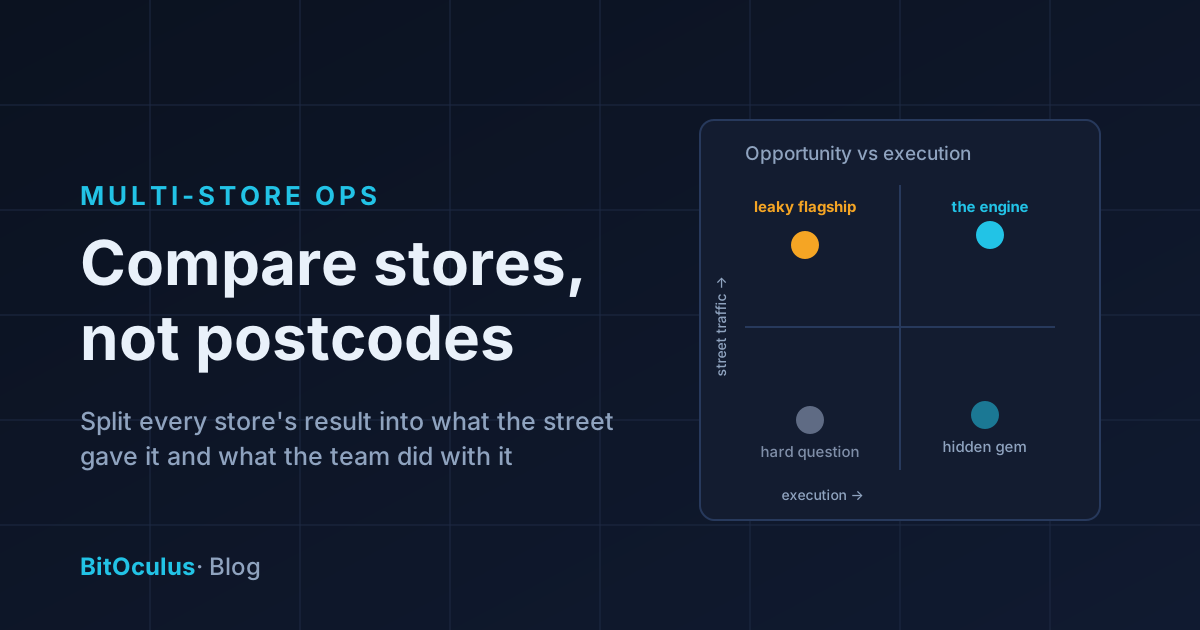
- High traffic, high execution — the engine. Protect it: this is where your best-practice actually lives. Document what its roster and floor do, because it's the template.
- Low traffic, high execution — the hidden gem. The league table buries this store; the grid reveals it. Its team is your asset — the practices (and often the people) belong in bigger rooms. Its site is a question for the lease file.
- High traffic, low execution — the leaky flagship. The most expensive square metres in the portfolio to run badly, and the highest-ROI fix available: the street already delivers the audience, so every point of capture or conversion recovered is pure upside. Diagnose in order — window (capture), then floor and roster (conversion, bounce).
- Low traffic, low execution — the hard question. Fix execution first (it's the part you control), but if the street number was never there, the honest conversation is about the site, not the team — and now you can have it with evidence instead of blame.
The grid also changes targets. A uniform "grow revenue 5%" asks the impossible of the thin street and nothing of the golden corner. Traffic-adjusted targets — capture and conversion goals set against each store's own baseline — ask every team for the same thing: do more with what your street gives you.
The weekly rhythm at portfolio scale
Multi-site measurement isn't a quarterly report; it's a short weekly loop:
- Scan the grid — five minutes for anomalies: any store whose capture or conversion moved sharply against its own baseline. A falling street number is a precinct event (roadworks, a closed anchor, seasonality); a falling capture or conversion number with a steady street is a store event. Different owners, different fixes — the same attribution logic that works for one store, running across all of them.
- Copy what the outliers do. When one store's conversion jumps after a roster change or a floor move, that's not a curiosity — it's a portfolio-wide experiment that one site ran for free. Multi-site is the one place where every local fix can pay N times.
- Let managers see their own numbers. A store manager who watches their own capture rate respond to their own window change stops experiencing head office as a league table and starts running experiments. The data is more valuable distributed than centralised — and live alerts put the moment-to-moment version (queues, capacity, dead mornings) where it belongs: with the person on the floor.
Season by season, the portfolio picture compounds — which sites the Christmas surge actually favours, which leases the traffic data supports renewing, and where the next store should go, measured before signing and forecast from ratios your existing stores have already proven.
Frequently asked questions
How do I compare performance across multiple retail locations fairly?
Normalise by opportunity: measure each site's street traffic, capture rate and conversion with identical instrumentation, then judge stores on the controllable numbers (capture, conversion, bounce) against their own baselines — not on raw revenue, which mostly reflects the location's traffic. The resulting opportunity-versus-execution grid separates location problems from execution problems.
What KPIs should a multi-store retailer track besides revenue?
Per store: street traffic (the opportunity), capture rate (shopfront execution), conversion and bounce rate (floor execution), and hourly power hours for rostering. Portfolio-wide: each store's trend against its own baseline, and the spread between best and worst execution — that spread is the size of the prize for copying internal best practice.
How do franchises use foot traffic data?
Three ways: fair benchmarking of franchisees on execution rather than postcode; evidence in site selection and lease renewals for each territory; and spreading proven practices — when one location's numbers jump after a change, the network can see it, verify it and replicate it instead of relying on anecdote.
Do I need the same people counter at every location to benchmark?
Yes — comparability is the point. Different technologies (or the same sensor configured differently) carry different error profiles, staff-filtering and deduplication behaviour, so mixed fleets produce grids that reflect instrumentation rather than performance. One consistent, accurate, staff-filtered setup per door is what makes cross-site numbers mean the same thing everywhere.
BitOculus runs multi-site fleets on one dashboard — consistent on-device counting at every door, per-store baselines, live alerts to each floor, and portfolio plans built for operators. See pricing, explore a live dashboard or talk to the founder.