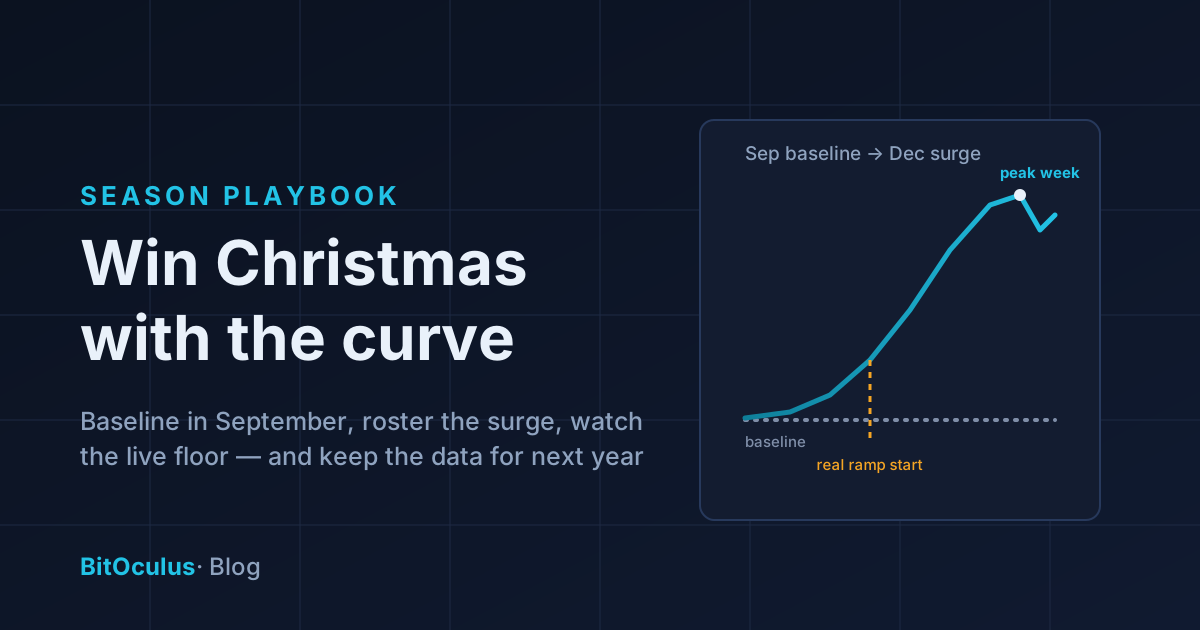
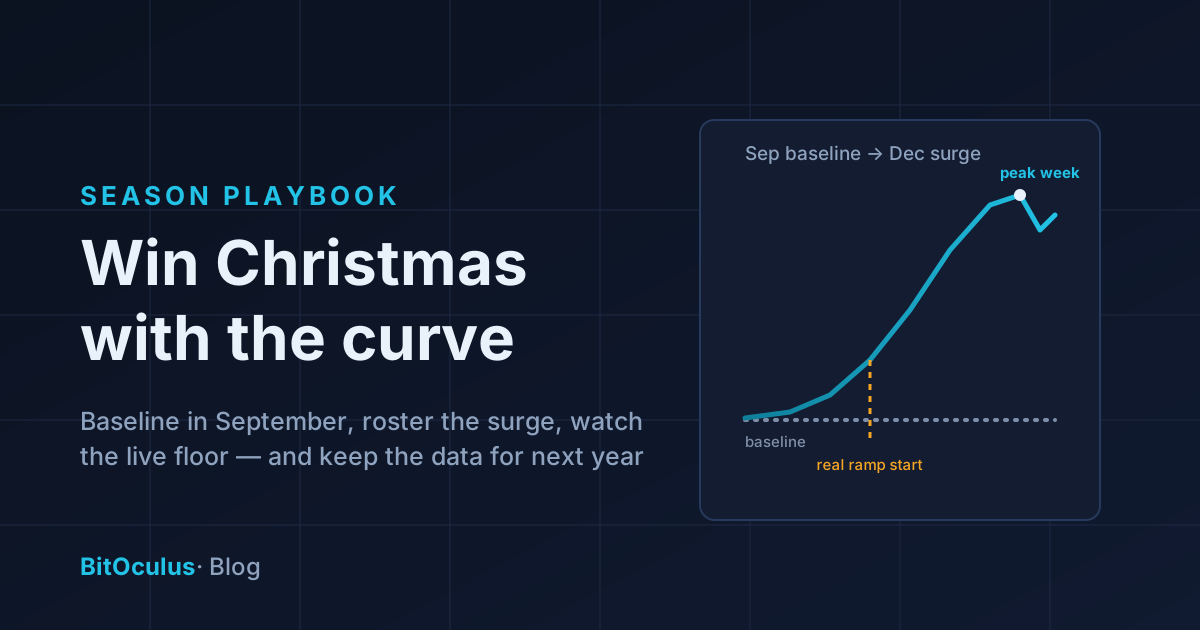
Preparing a store for Christmas with foot-traffic data comes down to four moves: establish your baseline curve now (before the season distorts it), roster the surge weeks to measured traffic instead of last year's memory, watch conversion and bounce in real time when the floor is at its fullest, and capture the whole season's data so next year's plan starts from evidence. The Christmas quarter is the most expensive, most crowded, most penalty-loaded stretch of the retail calendar — and most stores plan it from anecdote: "December's always crazy," "Boxing Day is our biggest day," "we put everyone on in the last week." Some of that folklore is true. The measured version tells you which parts.
Here's the season, in the order the decisions actually arrive.
September–October: build the baseline while it's still normal
The single most valuable thing you can do for Christmas is boring: measure ordinary weeks before the season starts. Your normal curve — entries, capture rate, conversion, power hours by day — is the yardstick every seasonal decision gets measured against. Without it, "December was huge" is a feeling; with it, "December ran 2.4× baseline, and the surge started Tuesday week two, not December 1" is a plan for next year.
Two pre-season jobs while trade is calm:
- Get the instrument in and verified now. A sensor installed in November learns your store during the least normal month of the year. Installed in September, it gives you six-plus weeks of clean baseline — and you'll have worked out how to read it before you're too busy to learn. (Choosing one? The buyer's guide.)
- Fix the findable leaks early. A sagging capture rate or a queue-shaped bounce problem costs a little every week in October. In December the same leak costs multiples of that, at the exact moment you're too stretched to fix it. Cheap repairs, made early, pay seasonal rates.
November: roster the surge to the curve, not the calendar
Seasonal staffing is where the money moves. The research case is well established: stores are systematically understaffed at their busiest hours, and fixing peak coverage was worth around 7% of profit — with realistic one-week-ahead traffic forecasting still capturing roughly 4.5% (Mani, Kesavan & Swaminathan, 2015). Christmas is that finding at maximum stakes: the peaks are higher, the queues longer, and every service failure reaches more customers per hour than at any other time of year. Understaff a December Saturday and you don't lose a sale — you lose a street's worth of them, invisibly, while the register still posts a record.
The Australian angle sharpens it further. Seasonal trade concentrates in premium-priced hours — late-night trading, weekends, and public holidays carrying loadings up to 225% plus 12% super (Fair Work Ombudsman, ATO). A mis-timed shift in December is the most expensive rostering mistake of the year, in both directions: idle premium hours if you guess high, walked-out customers if you guess low. The roster-to-the-curve playbook applies unchanged — just with last year's seasonal shape (or this year's live one) as the input, watched week by week as the surge builds:
- Find the season's true start. The ramp rarely begins when the calendar says. Watch for the first week entries run clearly above baseline — that's when the seasonal roster starts, not December 1.
- Trust the curve over the legend. Maybe Boxing Day really is your biggest day; maybe it's the 23rd. Maybe late-night Thursdays pull nothing on your street. The measured curve settles the argument before you pay penalty rates to find out.
- Brief casuals against the real peaks. Seasonal staff are expensive to onboard; putting their hours precisely where the crowd is makes each hour count double.
December: watch the live floor, not the week-old report
In December, the gap between "knowing on Monday" and "knowing now" is at its widest. This is real-time occupancy and alerting season:
- The queue alert earns its whole year in December. Entry-rate spikes above the hour's norm, thin floor — minutes of warning to open the second register before the queue becomes abandonment. Every bounced customer in December is carrying a gift list.
- Watch conversion by hour, not by day. Crowded floors convert worse per visitor — service thins as traffic thickens (Perdikaki, Kesavan & Swaminathan, 2012) — so a huge day can hide a collapsing 2–4pm window. The hourly view shows where an extra floor hand actually pays.
- Capacity, comfortably. For small-format stores, a live occupancy ceiling keeps the room shoppable at the exact moments it's tempted to become a crush.
January: the season's second payout
The sales are banked; the data is the other asset. One January hour with the season's curve answers questions folklore never can: When did the surge actually start and end? Which trading-hour extensions paid and which were empty premium-rate hours? What did the sale period do to traffic versus conversion? How did Boxing Day really rank? That review becomes next September's plan — and it compounds: the second measured Christmas is planned against the first, and the folklore era of your own store quietly ends. (Multi-store operators: the same season data, compared fairly across sites, shows which locations the season favours — and which need a different plan.)
Frequently asked questions
When should I start preparing my store for Christmas trading?
September — not for decorations, but for data. A people counter installed and verified in early spring gives you six or more weeks of normal-trade baseline before the seasonal ramp, which is what makes the December numbers interpretable and the staffing plan evidence-based rather than remembered.
How do I know how many staff to roster for the Christmas period?
Work from a measured traffic curve: last year's seasonal shape if you have it, this year's live ramp if you don't. Identify the true surge weeks and the daily peaks, staff ahead of them rather than into them, and re-check weekly as the season builds — December's curve moves fast, and one-week-ahead forecasting captured most of the research-verified profit gain. In Australia, precision matters most on penalty-rate days, where both overstaffing and understaffing are at their most expensive.
How do I stop losing sales to queues during the Christmas rush?
Instrument it: a queue alert fires when entry rates spike above the hour's usual pattern while the floor is thin, giving minutes of warning before abandonment starts. Pair it with hourly bounce and conversion tracking to see which hours leak — a big December day at the register can still be leaving a large share of its visitors unserved.
Is Boxing Day or the pre-Christmas week bigger for foot traffic?
It varies by street, format and city more than retailers assume — which is exactly the point of measuring. The pre-Christmas final week and the Boxing Day sales period are both candidates for the year's peak; the measured answer for your own door decides where your best staff, longest hours and biggest promotions belong.
BitOculus gives you the baseline before the season, the live floor during it, and the full curve after it — counted on-device with no footage ever stored. Get installed before the ramp: explore a live dashboard or join the founding cohort.