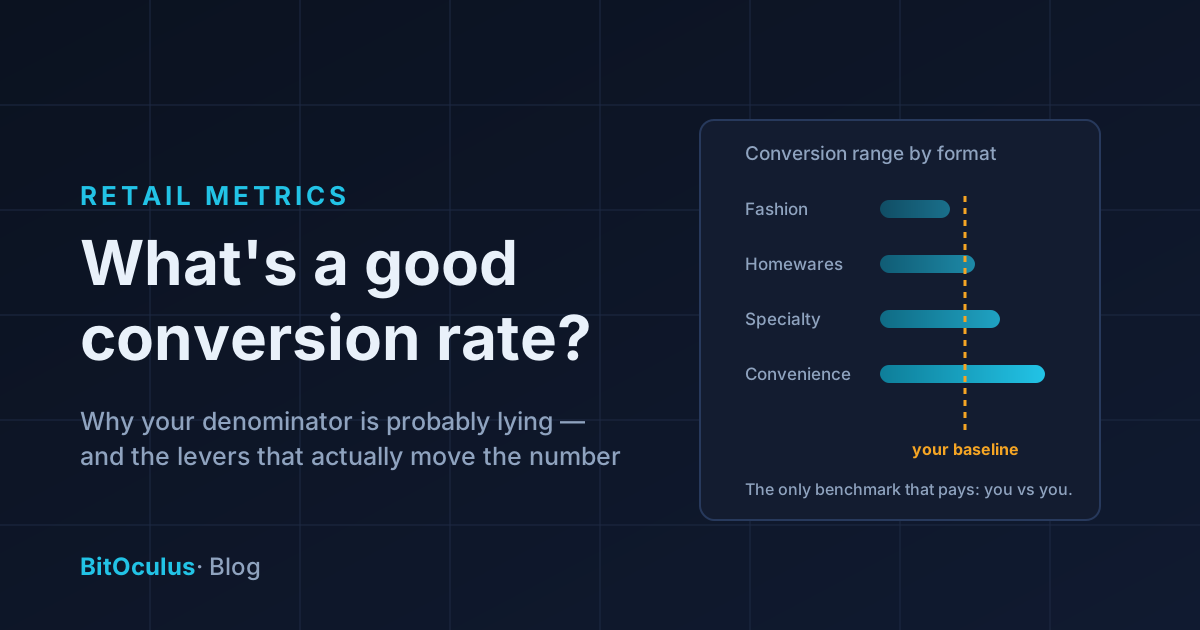
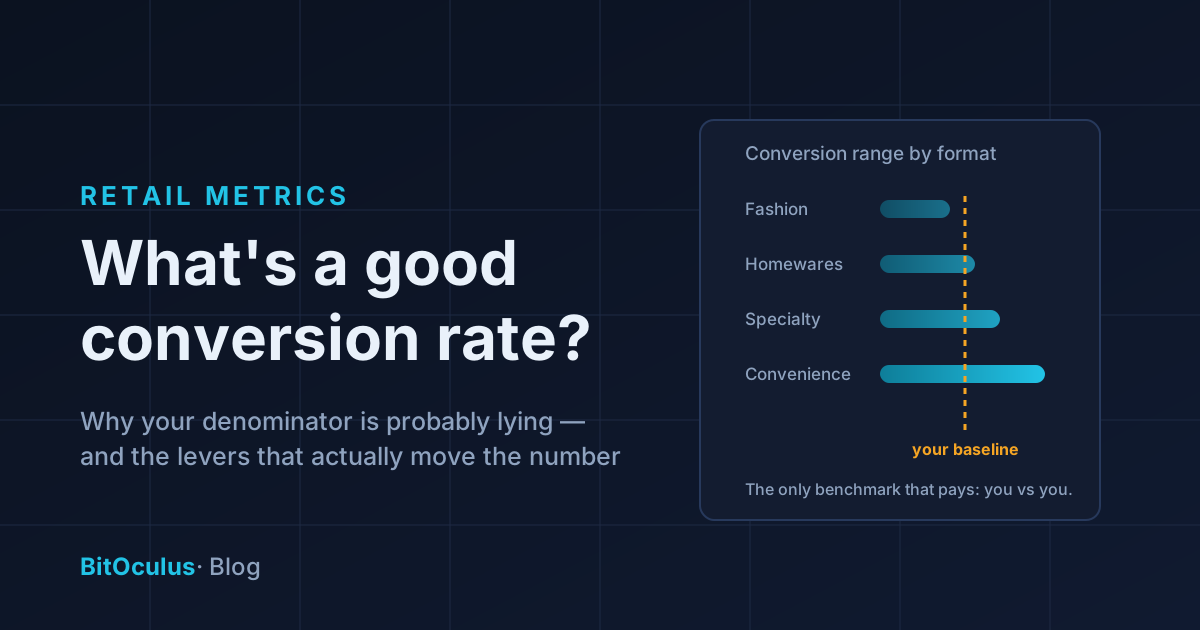
Retail conversion rate is the percentage of people who enter your store and buy something: transactions ÷ visitors × 100. Commonly cited figures for brick-and-mortar stores cluster in the 20–40% range, but the spread across formats is enormous — convenience formats convert most walk-ins, while browsing-heavy categories like fashion and homewares sit far lower — so the benchmark that matters is your own number, measured with an accurate visitor count. And that's the catch: most stores that quote a conversion rate are dividing real transactions by a guessed or inflated visitor figure, which makes the result — and every decision built on it — quietly wrong.
This guide covers how to measure conversion so the number can be trusted, what the benchmark ranges do and don't tell you, and the handful of levers with real evidence behind them.
The formula is trivial. The denominator isn't.
Transactions are easy — the till counts them perfectly. Visitors are where conversion rates go to die. Three failure modes account for most of the damage:
- No count at all. Conversion gets estimated from gut feel, which defeats the purpose: the whole value of the metric is telling you things your gut can't.
- A bad count. Infrared beam counters miss side-by-side walkers and count prams as people; Wi-Fi tracking drifts with phone privacy settings. Feed a noisy denominator into the formula and the output inherits the noise. (The technology differences are stark — roughly 80% accuracy for beams versus up to 99% for edge-AI vision.)
- A padded count. This is the subtle one. Staff crossing the door dozens of times a day, the customer who steps out for a phone call and returns, the courier, the kid trailing a parent — all inflate visitors and deflate conversion. A store whose true conversion is 30% can read 24% purely from an unfiltered denominator. Staff filtering and repeat-visit deduplication aren't nice-to-haves; they're what makes the metric mean anything. (What to demand from a counter covers both.)
Get the denominator right and conversion becomes the sharpest diagnostic in retail: a single number that says how well the store converts the demand it already has.
What the benchmarks actually tell you
Treat published conversion benchmarks the way you'd treat national house-price averages: real, but useless for pricing your house. The commonly cited 20–40% brick-and-mortar range hides systematic differences:
- Format. Destination and convenience formats (pharmacy, hardware, groceries) convert most visitors because people arrive intending to buy. Browse-first categories (apparel, gifts, galleries) convert a much smaller share by nature.
- Location type. A mall store fed by wandering traffic converts differently from a street store people chose to enter — same chain, same fit-out, different number.
- Traffic level itself. Conversion falls when traffic surges — the floor gets crowded, queues grow, service thins. A quiet Tuesday converting 35% and a heaving Saturday converting 22% is normal physics, not a Saturday problem. This is also why judging staff on raw conversion without traffic context is unfair.
So use benchmarks for one thing only: a sanity check that you're in a plausible range for your format. After that, the only comparison that pays is you versus you — this week against your baseline, peak hours against quiet hours, before a change against after it.
The levers that actually move conversion
Once the number is trustworthy, the improvement levers rank roughly like this:
1. Staff the peaks properly. The strongest evidence in the literature. Researchers matching hourly traffic, sales and labour across 41 stores found every one systematically understaffed at peak — and fixing it was worth about 7% of profit (Mani, Kesavan & Swaminathan, 2015). A companion study showed why: staffing moderates how traffic becomes sales — on a thin floor, each extra visitor is worth less because nobody serves them (Perdikaki, Kesavan & Swaminathan, 2012). If your conversion sags exactly when traffic peaks, you don't have a marketing problem; you have a roster problem — here's the playbook.
2. Kill the early exits. Bounce rate — visitors who walk in and promptly leave — is conversion's leading indicator. Queues, cluttered entrances, no visible staff, prices that ambush: whatever the cause, bounced visitors are conversions you lost in the first thirty seconds. Cutting bounce feeds conversion directly.
3. Fix the hour, not the average. A weekly conversion number hides everything useful. Hour-by-hour conversion against hour-by-hour traffic shows you when you leak: the Saturday 2pm crush, the understaffed weekday close. Fixes aimed at specific hours are cheaper and easier to verify than store-wide initiatives.
4. Test the floor like a webpage. Layout changes, fitting-room service, queue design, tap-to-pay at a second point — each is a hypothesis, and conversion before/after is the verdict. The discipline matters more than any single tactic: baseline, change one thing, re-measure.
One caution: don't chase conversion in isolation. A store can raise conversion by attracting fewer, more committed visitors — shrinking while looking healthier. Watch it alongside traffic and capture rate; growth needs all three pointing the right way. And if traffic itself is the constraint, that's a different playbook.
Frequently asked questions
How do I calculate retail conversion rate?
Divide the number of transactions in a period by the number of visitors in the same period, times 100. The transaction count comes from your POS; the visitor count needs an accurate people counter with staff filtering and repeat-visit deduplication, or the result will read lower than reality. Calculate it by hour and by day of week, not just as a weekly average — the pattern is where the actionable information lives.
What is the average conversion rate for a retail store?
Commonly cited figures for physical stores cluster around 20–40%, far higher than e-commerce (typically low single digits) because walking into a store signals much stronger intent than clicking a link. But the spread across formats is so wide — convenience formats near the top, browse-first categories near the bottom — that the average is a weak guide. Establish your own baseline and measure changes against it.
Why did my conversion rate drop when traffic went up?
Because conversion typically falls as traffic rises: more browsers in the mix, longer queues, thinner service per visitor. A drop during a traffic surge is expected — the question is how much it drops. If busy-hour conversion collapses, the research points first at peak understaffing, which is fixable and measurable within weeks.
Do I need a people counter to know my conversion rate?
Yes — the denominator is a headcount, and without a counter it's a guess. Accuracy matters too: an 80%-accurate beam counter or an unfiltered count (staff included, repeat entries double-counted) can move the resulting conversion figure by several points, which is larger than most real week-to-week changes you're trying to detect.
BitOculus measures true conversion — up to 99% verified counting accuracy, staff filtered, repeat visits deduplicated — alongside capture rate, bounce rate and your hourly traffic curve, all processed on-device with no footage ever stored. Explore a live dashboard or join the founding cohort.