A pop-up shop is a measurement problem disguised as a retail problem: you have weeks — not quarters — to learn whether the location works, whether the concept converts strangers, and whether a permanent store deserves to exist. That compression changes the playbook: instrument from day one, read daily instead of monthly, and treat the final dataset — street traffic, capture rate, conversion by hour — as a deliverable as important as the sales. A pop-up that ends with "we did $40k and it felt buzzy" answered none of the questions it was opened to answer.
Whether the pop-up is a brand experiment, a market test for a first permanent store, or a seasonal play, here's how to run the measurement so the six weeks keep paying after the fixtures come down.
Why pop-up data is worth more per day than any other retail data
A permanent store can afford slow learning; a pop-up can't — but in exchange, its data answers bigger questions per week than any established store's:
- It's a location audition. The pop-up is site measurement, upgraded: instead of counting a candidate frontage from outside, you're measuring the full funnel — street, door, sale — of a live trade in the actual room. No spreadsheet model gets you closer to "what would a store here actually do?"
- It's a concept test with strangers. Online, your brand sells to people who searched for it. A pop-up's capture rate measures the thing e-commerce can't: does the physical expression of the brand stop people who've never heard of it?
- It's evidence for the next negotiation. The measured run — traffic, capture, conversion — is the business case for the permanent lease, the next landlord conversation, or the investor deck. "Six weeks, 41,000 passers-by, here's the funnel" is a different meeting than "the pop-up went well."
The catch: none of that exists unless counting starts on day one. A six-week run has no spare fortnight to burn on "we'll set up measurement once we're settled" — by the usual standard of needing multiple weeks for a stable baseline, half your dataset is gone before you begin. Day one, or you're guessing.
Read it daily, act mid-run
A permanent store reviews monthly; a pop-up's data is only worth collecting if you act on it during the run. The operating loop is the fast version of everything we've written for permanent floors:
- Days 1–7: find the shape. When does this street actually deliver? Pop-up operators inherit trading-hour folklore from the precinct ("laneway's dead before 11") that one week of measured power hours confirms or kills. Adjust hours and the roster in week two, not in the post-mortem — on a six-week clock, rostering to the curve pays immediately or never.
- Week 2 onward: work the funnel like a growth team. One variable at a time, capture rate as the verdict: the window story, the signage, the open-door test, the sampling table. A pop-up is the highest-iteration-rate environment in physical retail — same discipline as a permanent shopfront's experiments, at 4× the tempo. Watch bounce with equal attention: pop-up browsers are curious, not committed, and a layout that makes leaving easier than engaging shows up in the first days' data.
- Throughout: let the floor manage itself in real time. Pop-ups run on skeleton crews, which makes queue and occupancy alerts disproportionately valuable — the one staffer elbow-deep in restocking gets tapped on the shoulder by the entry spike, not by the walkout.
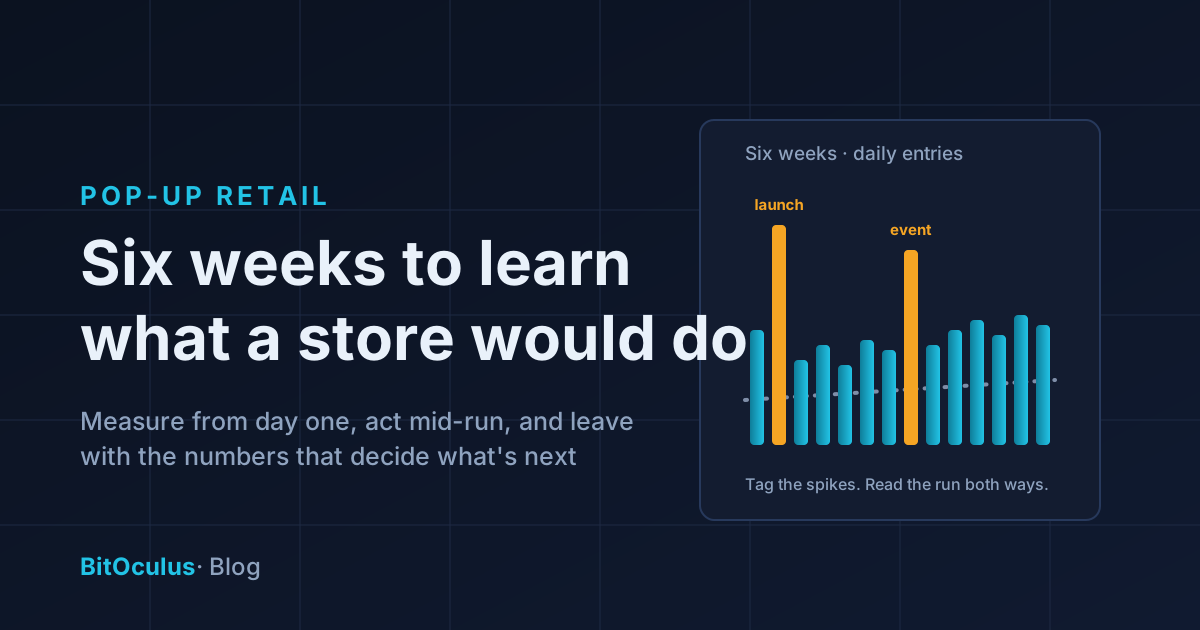
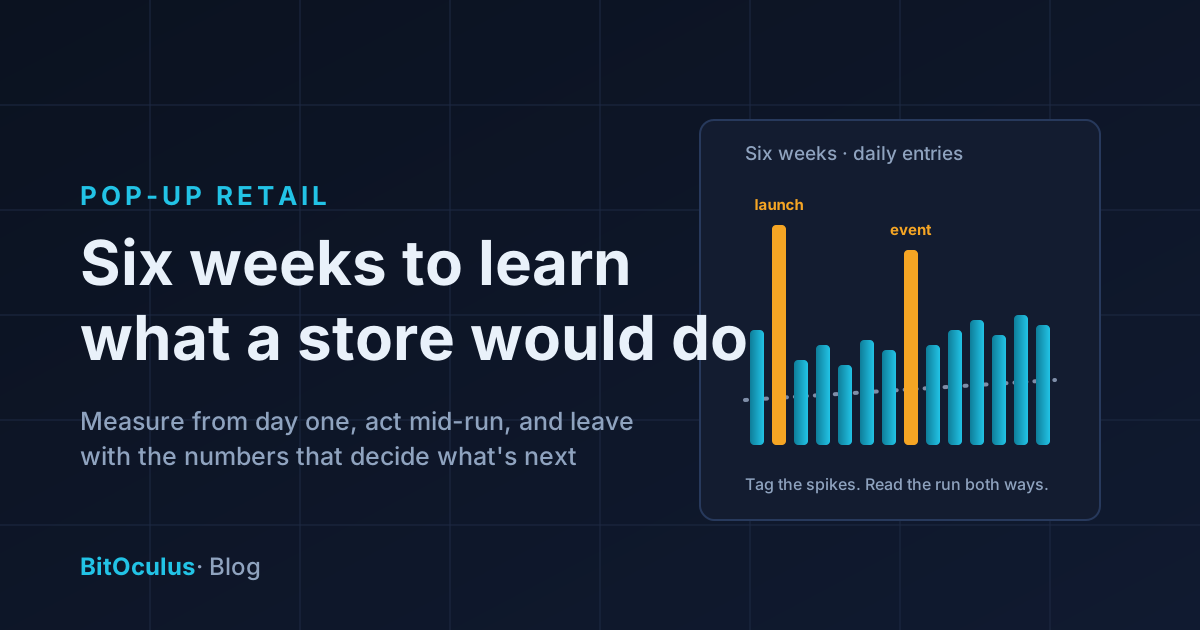
One pop-up-specific trap: event distortion. Launch night, the influencer visit, the market day next door — short runs are lumpy, and a naive average smears those spikes across the verdict. Tag the abnormal days and read the run both ways: with them (the run as it happened) and without them (the location as it trades).
The exit report: what the six weeks were actually for
The fixtures come down; the dataset is what you keep. The exit questions worth answering while the run is fresh:
- Would a permanent store here work? You now hold what site selection calls the grounded model — measured street traffic, your measured capture rate on this street, your conversion with this concept. Project it across a year of seasonality honestly (your six weeks sampled one season) and the lease decision becomes arithmetic plus judgment, instead of judgment alone.
- What did the brand learn about strangers? Capture rate by day-part and window-test results are brand R&D — which stories stopped traffic, which displays converted curiosity into entries. That transfers to the next pop-up, the wholesale pitch, even the website.
- What's the number for the next negotiation? Landlords increasingly court pop-ups as precinct activation; arriving at the next one with your measured funnel makes you a better tenant to bet on — and a sharper judge of the frontage they're offering.
A pop-up without measurement is an expensive party. With it, it's the cheapest market research physical retail offers.
Frequently asked questions
How do I measure foot traffic for a pop-up shop?
Install a compact people-counting sensor above the entrance before opening day — modern edge-AI units mount in minutes, need only power and Wi-Fi, and count anonymously with all processing on the device (no footage stored, nothing to explain to a temporary landlord). Positioned to see the street as well as the door, one sensor gives you passers-by, entries, capture rate and hourly patterns for the whole run.
What metrics matter most for a pop-up store?
Capture rate first — a pop-up exists to convert strangers, and capture rate measures exactly that. Then conversion and bounce (does the concept hold people once they're in?), hourly power hours (are your trading hours and roster matched to the street?), and the street count itself, which is the location audition for any future permanent store.
How long does a pop-up need to run to get useful data?
Useful signals arrive in days — trading-hour patterns inside the first week, window-test verdicts in days each. For the bigger question (would a permanent store work here?), four to six weeks gives a workable read provided you tag abnormal days like launch events, and remember the run samples one season — project annual performance with that caveat attached.
Can pop-up foot traffic data help negotiate a permanent lease?
Directly: a measured run is the strongest evidence a prospective tenant can bring — real street traffic, real capture, real conversion, in the actual precinct. It grounds the revenue model, supports (or argues down) the asking rent, and signals to the landlord that you run on evidence. It works in reverse too: if the six weeks say the street can't feed a permanent store, that's the cheapest no you'll ever get.
BitOculus sensors install in minutes and start counting on day one — street and door from a single unit, on-device processing, no footage ever stored, and a dashboard your whole run fits in. Opening a pop-up? Explore a live dashboard or talk to the founder.