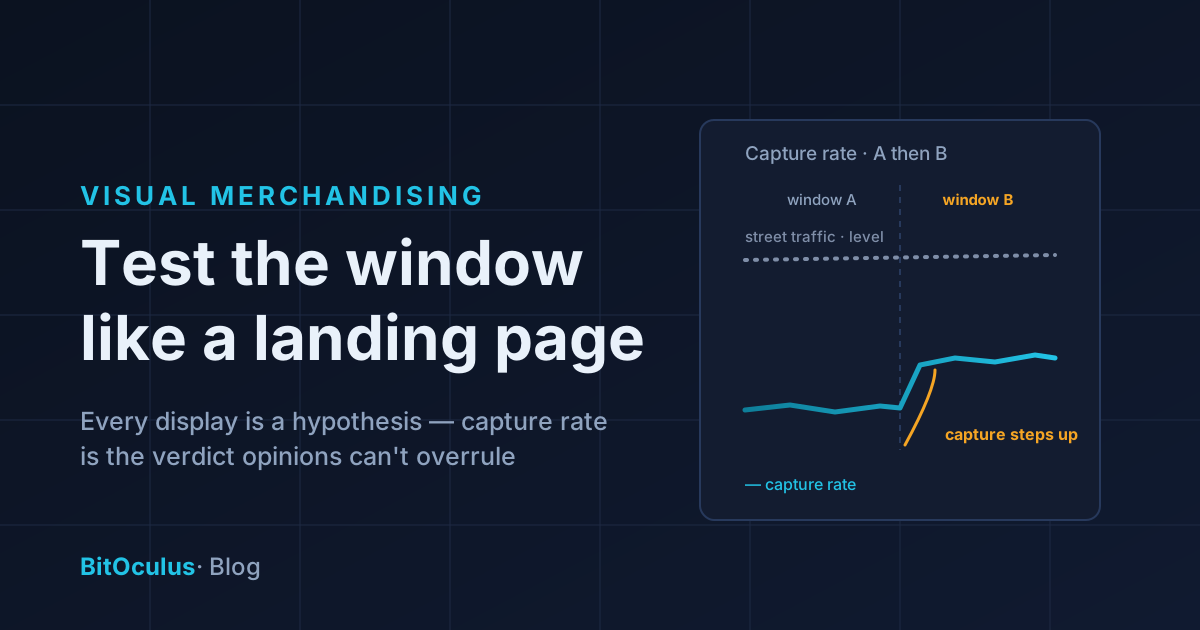
A window display "works" when it converts more of the people who walk past into people who walk in — and that's a measurable number: capture rate, entries divided by passers-by. Measure it before a display change and after, and visual merchandising stops being a matter of taste and becomes a testable craft: every window is a hypothesis, every fortnight of capture data is a verdict. Without the measurement, window decisions are settled by the loudest opinion in the room, and the shopfront — the highest-exposure marketing asset most stores own — runs on vibes.
This is the practical guide: what to measure, how to run a clean window test, the variables worth testing first, and the honest limits of the method.
The window is a landing page with no analytics
Think about what a shopfront actually is: a marketing asset seen by more people than most stores' entire ad budget reaches, refreshed occasionally, and — in almost every store — completely unmeasured. E-commerce would call that malpractice. No online team would redesign their landing page and judge the result by whether the team likes it; they'd watch the conversion of visitors to clicks. The physical equivalent has simply been missing the instrument.
Capture rate is that instrument. It isolates precisely the job the window does — stopping and converting passing traffic — and separates it from everything downstream (what happens on the floor) and upstream (how many people the street delivers). A sensor that counts the footpath as well as the door gives you the number continuously; from there, VM becomes an experimental discipline.
Running a clean window test
The method is simple; the discipline is what makes it valid:
- Baseline first. Two weeks minimum of capture rate on the current window, broken out by day-part — because a window performs differently against morning commuters and Saturday browsers, and averages smear the signal.
- Change one thing. A full re-dress tells you the new window beat the old one, but not why. If you want reusable knowledge — does product-density matter? does the sale sign help or cheapen? — vary one element per cycle.
- Run it long enough. Give each variant at least a full week — ideally two — so every day-of-week pattern appears once. Judging a window on three days confuses the weekly rhythm with the display's effect.
- Compare like with like. Same day-parts against same day-parts; a fortnight straddling a public holiday or a weather run needs the anomalous days tagged, the way pop-ups tag event spikes.
- Watch the downstream too. A window that stops more people but attracts the wrong people shows up as rising capture with falling conversion or rising bounce. The window's real job is qualified entries, not raw ones.
What to test first: the high-leverage variables
Every street differs, but the variables that most often move capture rate are worth testing in roughly this order:
- The message count. One story per window is the classic rule — test it. A passer-by gives you seconds; windows that try to say five things usually say none, and the data will tell you what your street's attention span actually is.
- Legibility at walking distance. Price points, offer text, brand names — visible at three metres and a walking pace, or decorative? Test big-and-few against small-and-many.
- After-dark lighting. If your street carries evening traffic, the window's dusk-to-close capture rate is its own experiment — many shopfronts effectively close hours before the footpath does.
- Rotation cadence. Regulars go blind to a static window; capture rate against your most frequent passers-by decays. Test fortnightly against monthly rotation and let the decay curve set your VM calendar, not the other way round.
- The threshold itself. Open door versus closed, clear entry sightline versus cluttered — friction at the last metre shows up in capture like nothing else.
Whatever you test, log it: date, change, hypothesis. Six months of logged experiments is a proprietary playbook for your frontage — knowledge no consultant or competitor holds.
The honest limits
Measurement sharpens VM; it doesn't replace it. Three caveats keep the method truthful:
- Capture rate can't judge brand-building. A window that builds recognition without immediate entries — a launch tease, an artistic statement — is measured unfairly by next week's capture. Decide before the test whether the window's job is traffic or brand; only hold it to the metric it was built for.
- Small streets need longer tests. Statistical honesty scales with traffic: a frontage passing a few hundred people a day needs more weeks to distinguish a real lift from noise than a busy strip does. When in doubt, run the variant again.
- The street moves under you. Season, weather and precinct events shift the denominator; that's why the comparison is always capture rate against like periods, never raw entries — and why a permanent sensor beats a borrowed fortnight of counting.
Frequently asked questions
How do I measure whether my window display is effective?
Measure capture rate — entries divided by passers-by — for at least two weeks before the change and two weeks after, using a sensor that counts the street as well as the door. If the new display converts a higher share of the same passing traffic into entries (with day-parts compared like-for-like), it's working; if not, iterate. Opinions can't settle the question; the footpath can.
What is a good capture rate for a shopfront window?
Benchmarks vary too much by street type and category to be useful — a commuter strip, a weekend precinct and a mall corridor behave differently. The workable standard is your own baseline: measure the current window, then judge every change by whether it beats it. Trend beats benchmark.
How often should a window display be changed?
Let the data set the cadence: capture rate on a static window typically decays as regular passers-by stop noticing it. Rotate when your measured curve starts sagging rather than on a fixed schedule — for busy streets with repeat foot traffic that's often every few weeks, but your frontage's decay curve is the real answer.
Can I A/B test a physical window display?
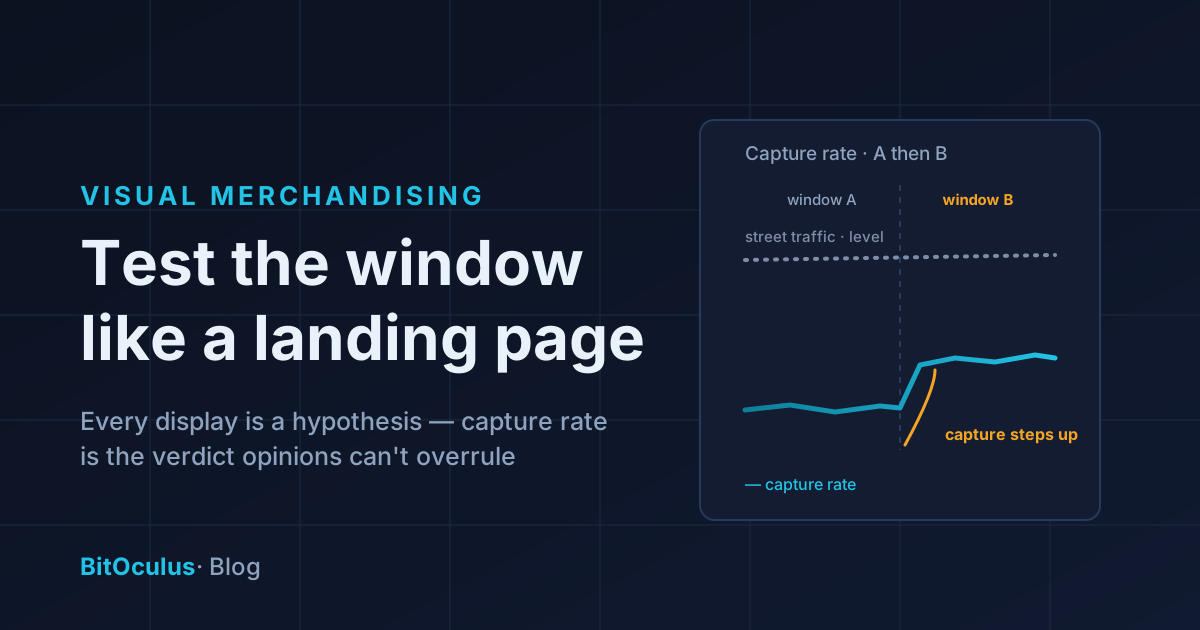
Sequentially, yes — physical windows can't split traffic like a webpage, so you test variant A for a fortnight, then variant B, comparing capture rate across like day-parts and tagging anomalous days (holidays, weather runs, events). One variable per cycle gives you reusable knowledge rather than one-off verdicts.
BitOculus counts your street and your door from one sensor — live capture rate by day-part, on-device processing, no footage ever stored — so every window you dress gets a verdict, not a debate. Explore a live dashboard or join the founding cohort.